MongoDB Atlas® Admin API
Overview
The MongoDB Atlas DBaaS service (www.mongodb.com/atlas) is a popular cloud datastore. There is an administration API for interacting with Atlas which includes accessing configuration information such as clusters, along with retrieving invoices. This API is independent from using the MongoDB query language to query the stored application data itself.
The beneficial use cases of this interface include:
- Providing consolidate analysis and configuration information on your Atlas deployment saving significant page navigation to each of the many separate information areas,
- Summarizing organization and project level information which can include interactive links to the MongoDB web console, and
- Analyzing your Atlas invoices.
For more details see https://www.mongodb.com/docs/atlas/api/.
Prerequisites and Troubleshooting Considerations
The Qarbine Administrator configures Data Services to use an Atlas API key to access a particular MongoDB Atlas instance. That API key has various options for permission and network access rules as well. When this is not done the following is likely going to be shown.
In addition, if there may be restrictions regarding which IP addresses can use the Atlas token to access the Atlas Admin IP objects. As a result you may run into the following error.
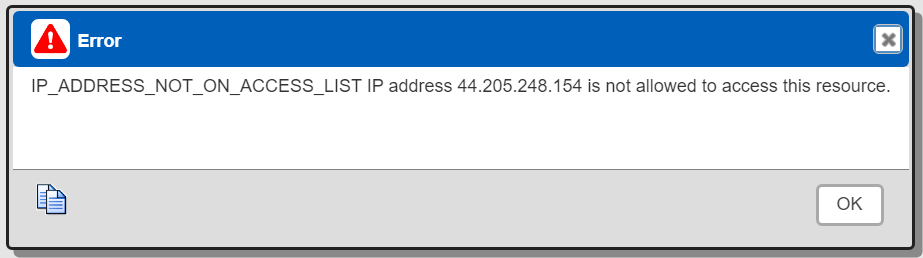
The address in question is that of the Qarbine host trying to access the Atlas instance and not the end user’s browser.
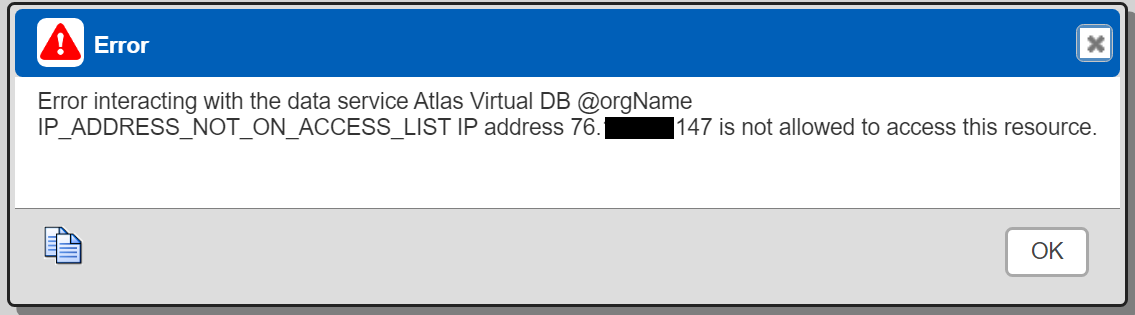
When running a query from a “not allowed” IP address for the associated Atlas API key an error may also be shown in ways such as this

or this
The separate document for Qarbine administrators has more details describing MongoDB Atlas query integrations and permissions.
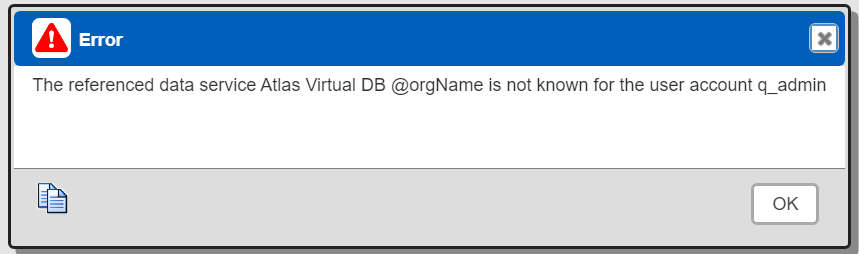
When running queries as experiences an error such as the following

Then dynamic data services may be in place. Double check the user’s annotations for “orgName”. This may be defined by the user and is visible by clicking in the upper right hand corner

And clicking on the tab shown below.

The Qarbine Administrator should check annotations for the associated user’s Principal and any access group objects. This is done within the Administration tool window.
Data Visibility
Since Qarbine the software is deployed by you the customer, Qarbine the company has zero visibility to your data retrieved by this or any other Qarbine data interface.
Sample Templates
There are many prebuilt Atlas operational templates which reference a Qarbine Data Source that require Atlas API credentials. These reports include billing analysis for example. These reports are different from the analysis reports on your data stored within Atlas. As a reminder, if MongoDB Atlas operational reports are going to be run, then Qarbine compute node IP addresses must be added to the Atlas API allowed IP list, not the IP address of user browsers.
For reports on MongoDB databases and collections see the other example folder shown below.


The Qarbine Administrator can define a data service “Atlas Virtual DB” to satisfy the data service references from these components.
Defining a Data Source
Overview
A Data Source is a Qarbine component responsible for retrieving data from somewhere. At a high level it has a name, a description and some arbitrary query string which when sent to the associated Qarbine Data Service endpoint returns some data. In this writeup we are using the MongoDB Atlas Administration API to retrieve information. The overall execution flow for an analysis, including the optional prompt component, is shown below.

A single data source can be referenced by name from multiple Qarbine template components. This enables a single point of change when perhaps, an index is added, or some other query tweak is necessary. The alternative is to attempt to find all templates impacted by a schema or index change for example. The component reusability is especially beneficial when team members have varying roles and skills.
Querying Language
MongoDB Atlas provides an API to interact with many of the configuration and operational aspects of Atlas. Qarbine provides a MongoDB Query Language (MQL) and SQL interface to this set of data. Your familiar query skills can be applied to retrieve and present Atlas configuration and operational information.
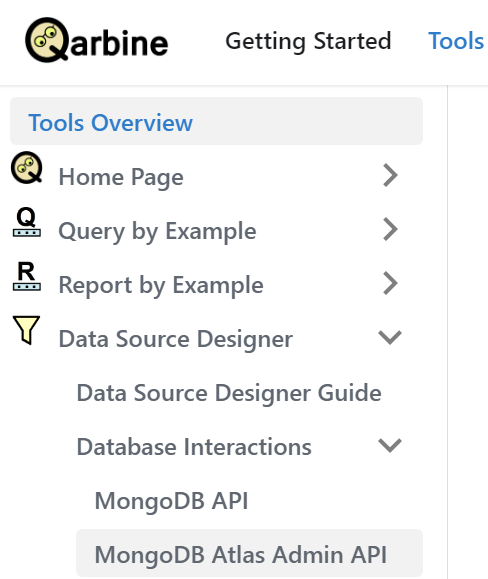
For details on the query options see the document at doc.qarbine.com within the area highlighted below.
Initial Component Setup
Open a new Data Source Designer tool via:
- Home page,
- Signing on and choosing Data Source Designer front he drop down, or
- The hamburger menu option on any tool.
If you already have a Data Source Designer tool open the start a new component by clicking

The Qarbine Administrator defines a Qarbine Data Service to access a MongoDB Atlas instance using the Atlas API. The name of the Data Service will be selectable by you if so desired by the administrator.
This example uses an explicit Data Service set up by the Qarbine administrator.
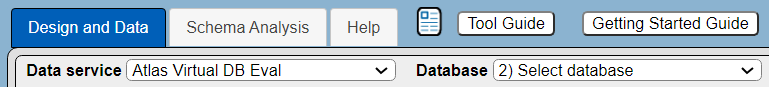
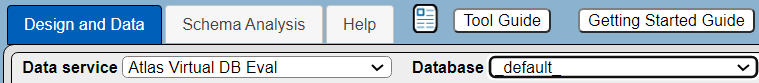
Next select a “database” from the dropdown.
The collections drop down is populated now as shown below.
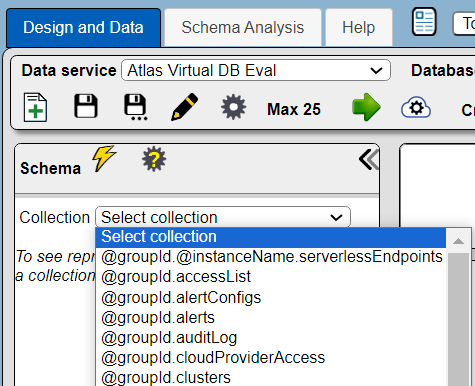

These logical collections are described in more detail in the document referenced by the “Query Language” section above.
To get general structure information about a particular collection select it from the dropdown.

Managing Answer Set Size
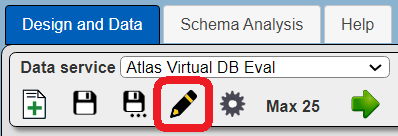
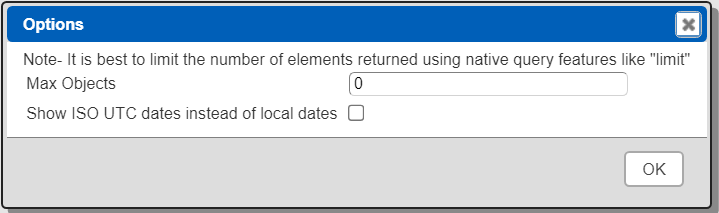
The default maximum number of rows starts off at 25 for a new data source. This is useful to evolve a query from a concept to one that you have verified returns the desired answer set. As noted, any native way of limiting an answer set size is the preferred approach. This setting is in the component dialog as shown below and also accessible by clicking the ‘Gear’ icon.
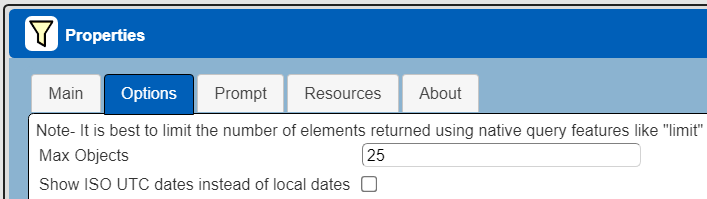
Once you are done drafting you can adjust this parameter. A “0” indicates there is no maximum. A number greater than 0 indicates to limit the final answer set size to that number of rows. This answer set truncation comes after any native query limit. So, if the answer set from the data endpoint is quite large, that content has to be returned to the Qarbine host. It then may truncate the number of rows. It is best to truncate at the query level (i.e., use a limit) to reduce the content sent from the data endpoint to the Qarbine host in the first place.
Running the Query
As a query specification enter the following MQL
db.orgClusters.find()
or the equivalent SQL
select * from orgClusters
To run this click

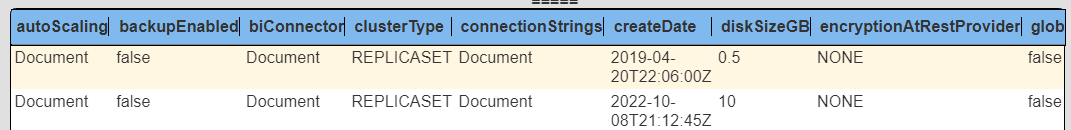
The Atlas API query is run and the results are shown.
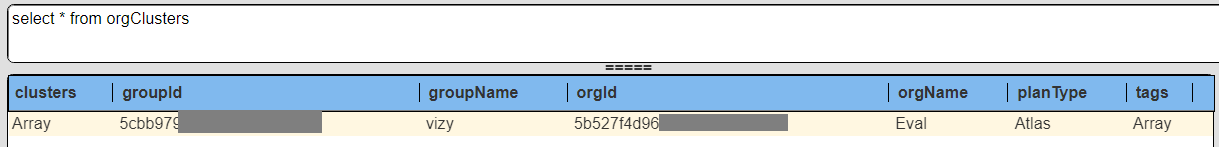
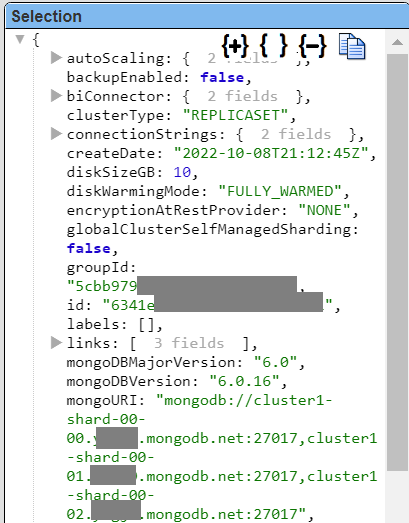
Selecting a row populates the details area to the right.
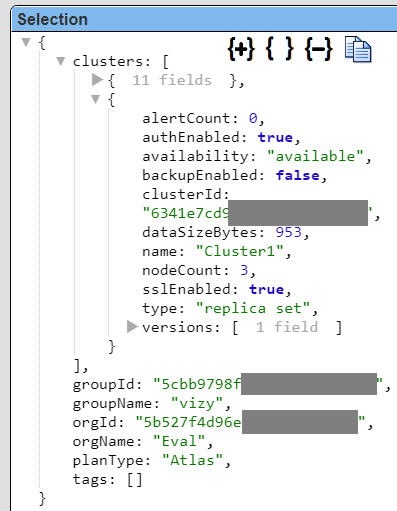
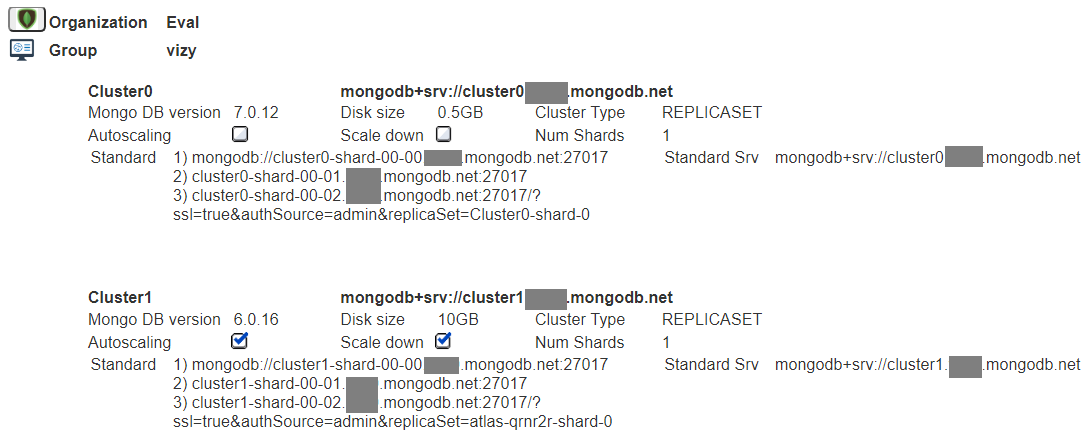
This Atlas instance named “vizy” has 2 clusters as indicated in the embedded clusters array.
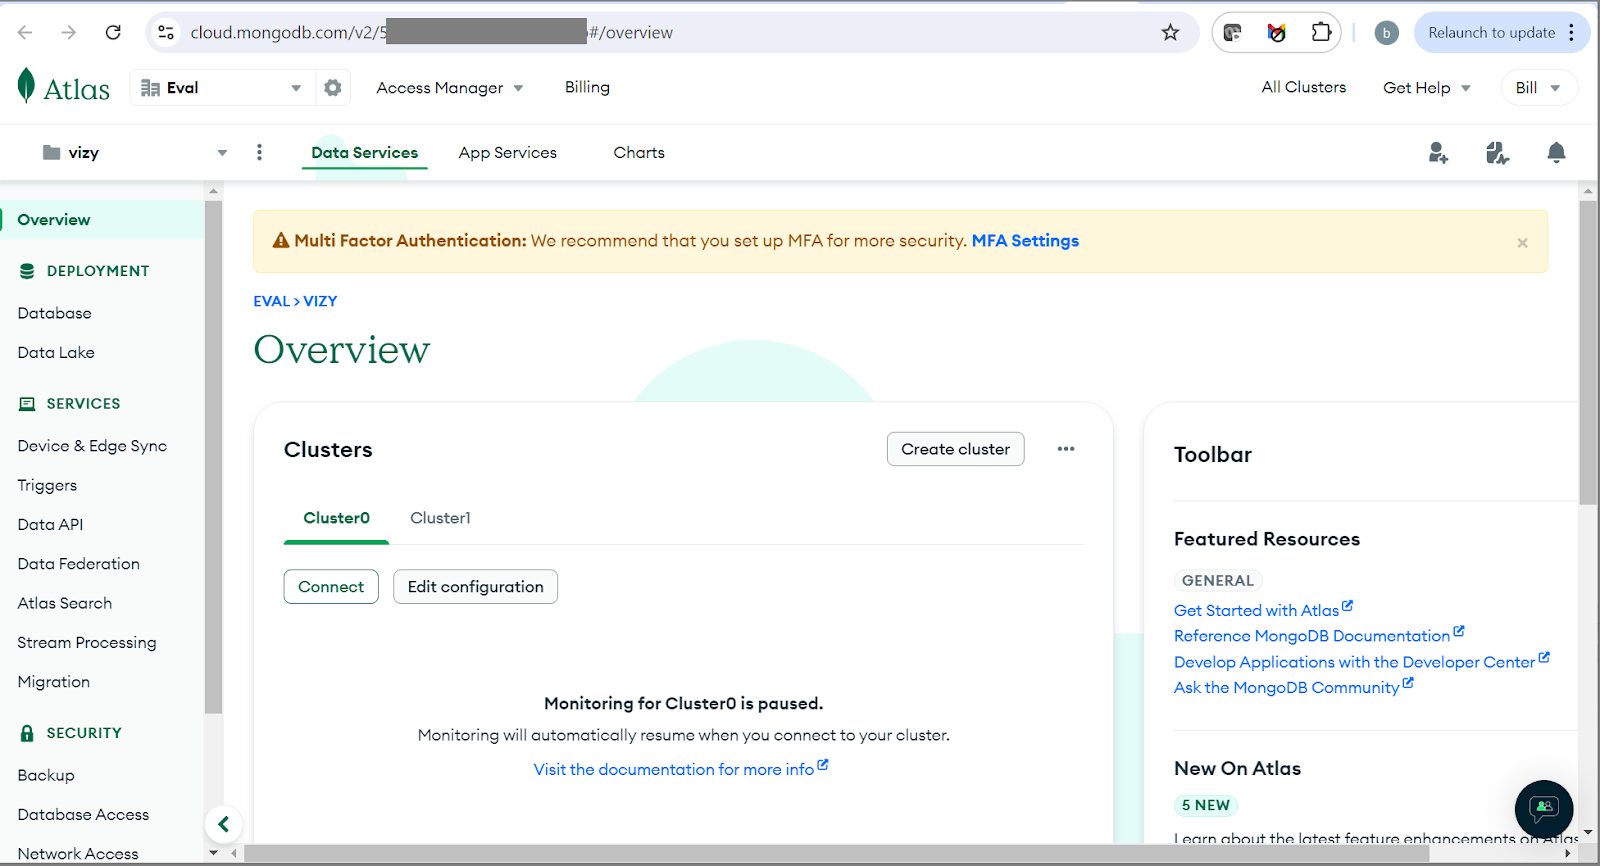
In the standard MongoDB Atlas console this is shown for that group\project.
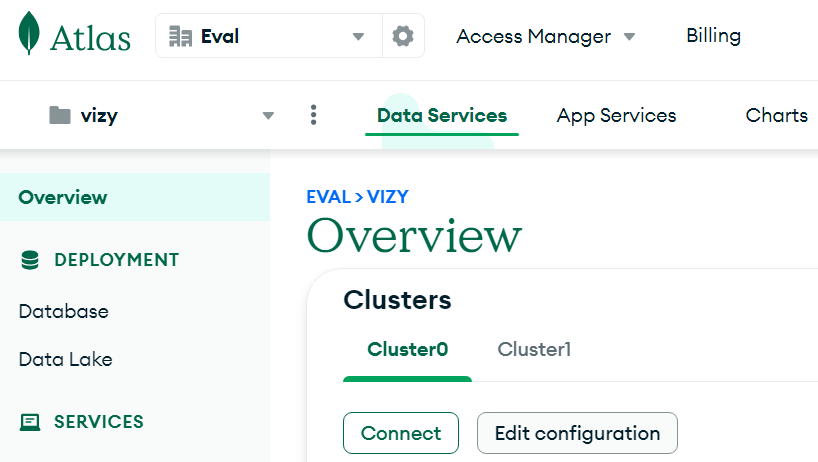
The MongoDB Atlas console provides navigation options for many properties of an Atlas deployment. Qarbine’s Atlas Admin API feature lets you consolidate many of them into a single, quickly reviewable analysis. The analysis can include drilldown and other interactive features as well.
Using Prompts
Overview
Qarbine prompts provide a way to obtain runtime values and variables for data source and template execution. To avoid hardcoding, prompts can use macro formulas to run queries which populate list widgets. Prompts are defined in a no code manner using the Prompt Designer. Shown below is the execution flow when there is a Prompt component.

MongoDB Atlas API Aware Prompts
Most of the Atlas API queries have either an organization or a group project associated with them. The MongoDB Atlas Admin API data model is described in the data interactions document noted in the “Query Language” section above.
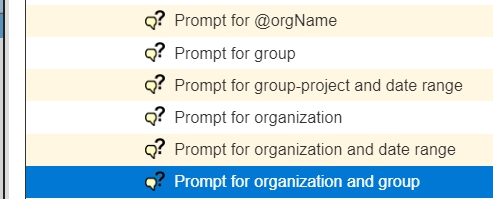
There are several prebuilt prompt components for use by MongoDB Atlas Admin API components. Below is one to project for a group\project of an organization.
Let’s create a retrieval specification that uses one of these built in prompts. To reference one of these MongoDB Atlas Admin API aware prompts click the highlighted button shown below.
Activate the Prompt tab.

Choose the drop down option shown below.

Click the “Choose from catalog” button.

Navigate to the folder shown.


There are several predefined prompts. For this example choose the one highlighted below.
Click

The prompt reference is filled in.

Close the properties dialog by clicking
For this example we are going to get more details on the organization’s clusters. To get a general idea of that information choose the collection noted below.
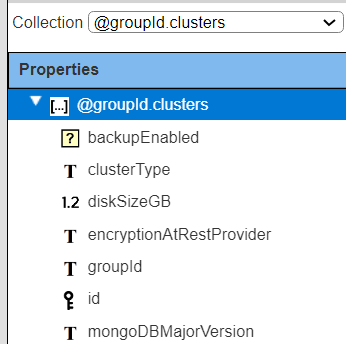

For an initial query enter the following.
db.[! @group.id !].clusters.find().sort( {name:1} )
It is equivalent to
select * from [! @group.id !].clusters order by name
At this point when running the component the prompt is presented for the user to select an organization and a contained group. Two runtime variables are set: “org” and “group”. These objects each have a name and an id field. The group object’s id value is inserted into the query using the block notation “[! … !]”. For example, if the group object has a name of “vizy” and id of “abcdefg1213456” then the effective query is
db.abcdefg1213456.clusters.find().sort({name:1} )
or
select * from abcdefg123456.clusters order by name
Click the run button

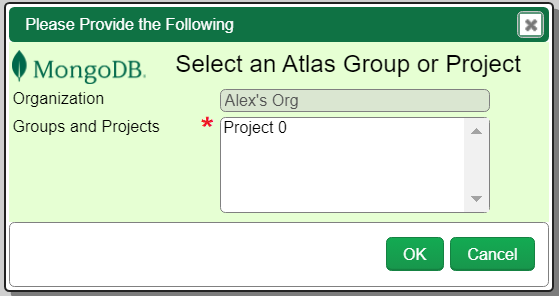
A 2 list prompter appears as shown below.
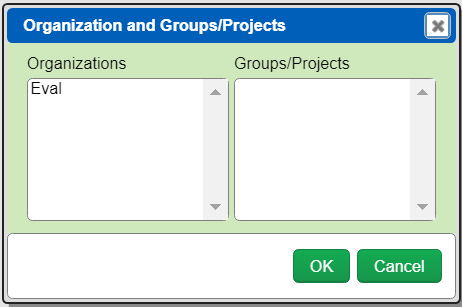
Selecting an organization in the left hand list populates the right hand list.
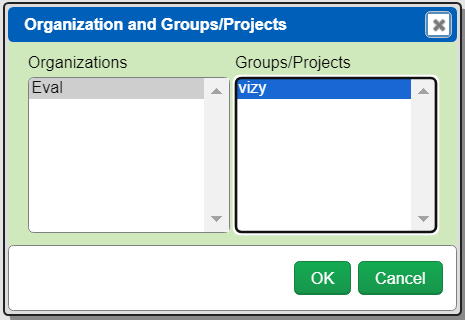
Accept the prompt values by clicking

The query is adjusted as described above and run. The results are then shown.
Click on a row to see its details on the right hand side panel.
Adjusting Maximum Rows
Recall the default maximum rows at the component level is 25. At this point you can change that setting by clicking.

Adjust the setting to “0” indicating no Qarbine answer set truncation.
Click

Saving Your Component
Save this new data source component by clicking

Navigate to the target catalog folder within the dialog.

Fill in the properties as desired.

Click

This data source is now stored in the catalog and may be referenced by other components. It is also remembered as a recent data source.
Using the Template Designer
Overview
The next step is to format a detailed report for the data retrieved by the data source just defined. The result can include interactive components and even include links to open up the MongoDB Atlas console pages. Below is a sample output which includes interactive buttons to open corresponding MongoDB Atlas web console pages.
Specifying the Analysis Data
Open the Template Designer.
Open the properties dialog by clicking  .
.
The initial data retrieval is shown below.

. . .

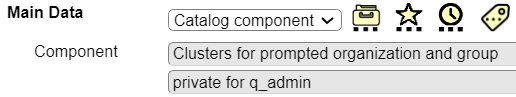
Click on the recent icon  . In the dialog listing, choose the Data Source you just created above.

Click OK to close the selection dialog.

The component reference is filled in.
Click OK to close the template properties dialog.
Defining the Initial Template Cells
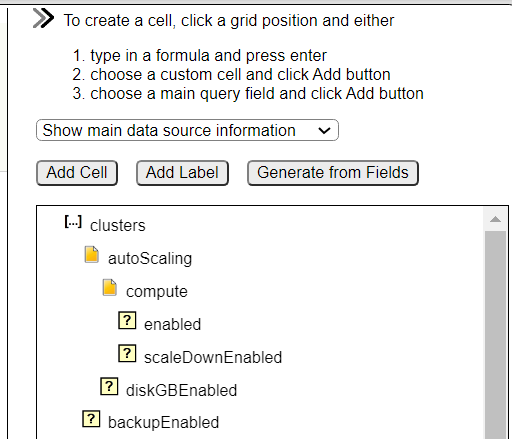
The right hand side of the Template Designer shows the general properties of the data expected to be returned from the data source just selected.

At this point in time it is useful to still have the Data Source Designer open to see actual values of these properties. If you do not have one open then simply open up another tab with the Data Source Designer, load your data source, and run it.
As a start let’s create cells to display the chosen organization and groups. Click the grid position shown below.

Enter the formula as shown below and press enter.

The line now shows

Click just to its right.

Enter the formula below and press enter.
= @org.name
Recall the prompt sets an organization object value into the “org” variable and a group object into “group”. This formula obtains the “name” field’s value from the “org” object variable. The line now looks like the following.

The cell is a bit narrow so adjust it via the width entry field or ‘>’ button.

The line now looks like the following.

Add another report header line by clicking

Perform the same steps for the group variable on the additional report header line. The lines should end up looking like the following.

For each of these lines, select them in the left hand side

and then click

The lines now look like the following

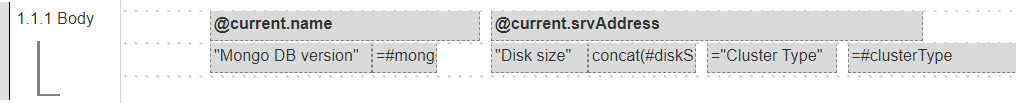
Next we start defining the cells for the body section, Click the grid cell shown below.

On the right side scroll down and select the field shown.

Click

A new cell is added to the template grid and it is selected.

The widget will vary based on sample data. Increase the width as shown below.

By default a new cell is set to occupy at most 40 grid positions. The formula may use ‘#FIELD_NAME’ or the equivalent “@current.FIELD_NAME”.
Click to its right to select another empty grid location.

On the right side scroll down and select the field shown.

Click
A new cell is added to the template grid and it is selected.

Select the body line itself by clicking on the far left line label.

Bold all of the cells by clicking

The updated cells are shown below

Add another body line for additional content by clicking

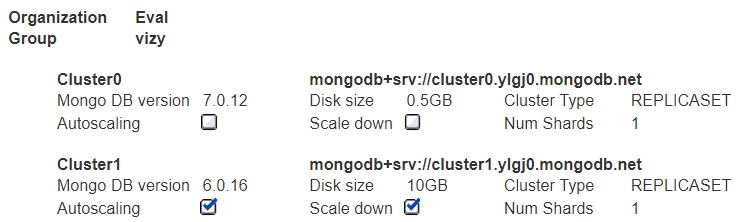
The end result is going to be

The cell positions and formulas are shown below.
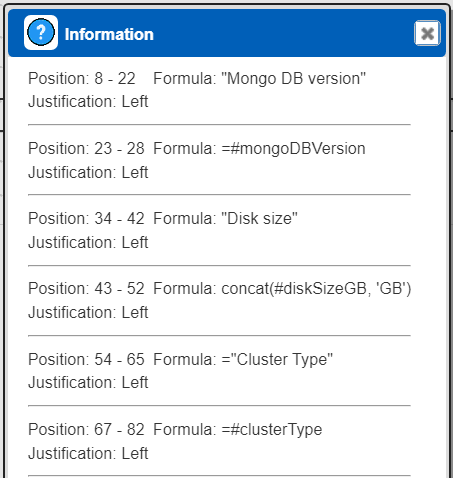
The disk size cell at position 43 uses the concat() macro function to concatenate the diskSizeGB value with the string “GB”.
Add another body line to separate out each cluster in the displayed result by clicking
The body section is shown below.
Running the Initial Template
Run the template by clicking

The referenced Data Source references a Prompt so that component is run and presents to the user the following dialog.
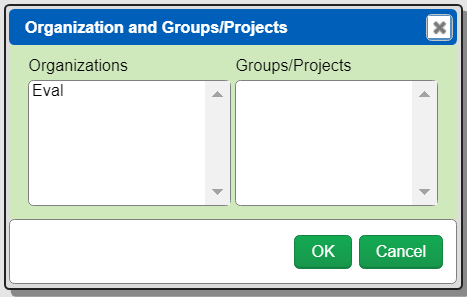
As before choose an organization and a group and then click

At this point the output is shown below.
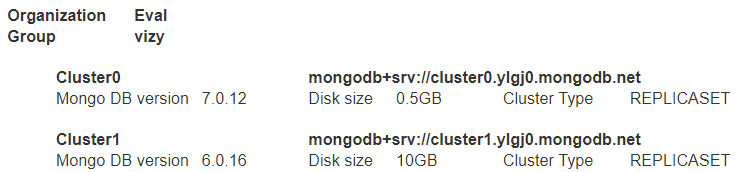
For each cluster in the chosen group the body section is iterated through. In this example there are 2 clusters so we see the output from running through the body section twice.
Saving Your Work
To save your template click

Navigate to the target catalog folder
Fill in the properties as desired.

Click
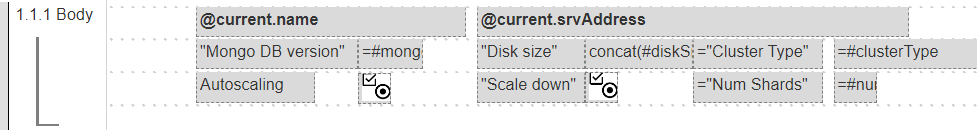
Adding Other Cluster Fields
From here we can add another body line by selecting the body line in the left hand area and then clicking one of the plus button options.

Click the grid location shown below.

In the formula entry field enter “Autoscaling” and click enter to add a label.

Click the grid position to its right.

On the right hand side select the field highlighted below.

Click
A new cell is added with the formula

and the template’s grid now shows.

Since the property was a boolean, Qarbine’s boolean graphic custom cell was used. This is one of many custom cells Qarbine provides for presentation and interactive flexibility beyond static text found in other tools.
Additional cells can be added to the 2nd body line and an additional blank line added for formatting. The updated template is shown below.
Running this results in the following.
Save the updated template by clicking
It is also remembered as a recent template.
Qarbine and MongoDB Web Console Interaction
The result of the following steps is an analysis that includes interactive buttons and connection string details. Shown below is the output for one of the clusters.
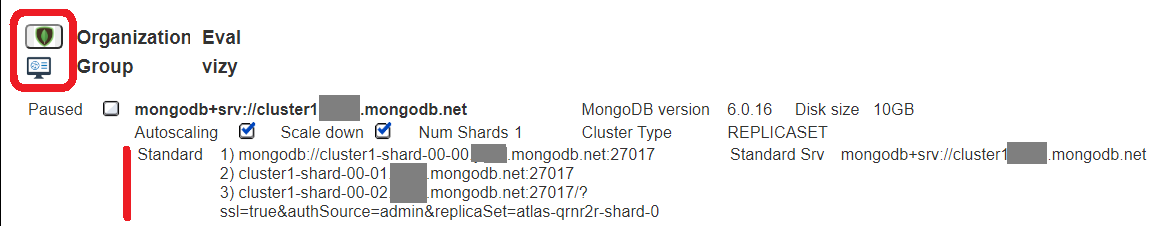
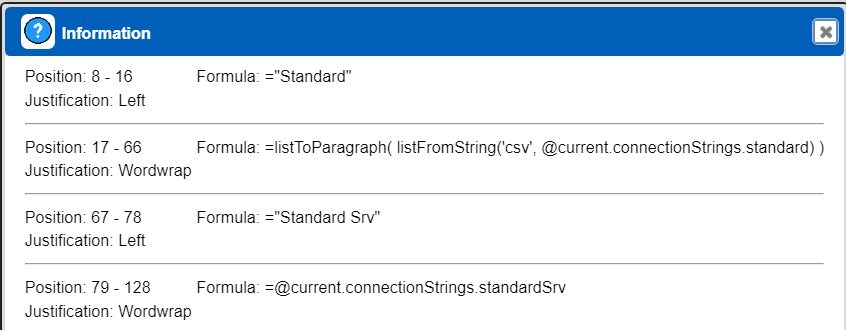
The vertical red line indicates the details on the standard and SRV connection strings for each cluster. The cells for this body line are shown below.
For the organization an interactive button is used via the button custom cell. Its formula is
= urlAction(concat("https://cloud.mongodb.com/v2#/org/", @org.id, "/projects"))
On the right hand side panel, its “Icon URL” formula is
baseFileUrl("asset/logo/mongoDb.png")
For the group an interactive “Open URL” custom cell is used to show an alternative to the button technique. Its formula is
concat("https://cloud.mongodb.com/v2/", @group.id, "#/overview")
The button custom cell provides a lot more presentation flexibility. Interacting with either of these custom cells in the result opens the appropriate MongoDB console page. This enables MongoDB developers to rapidly move from a Qarbine analysis to the MongoDB web console.
Save the updated template by clicking
Run the template and review the results.
Clicking the left side icon here

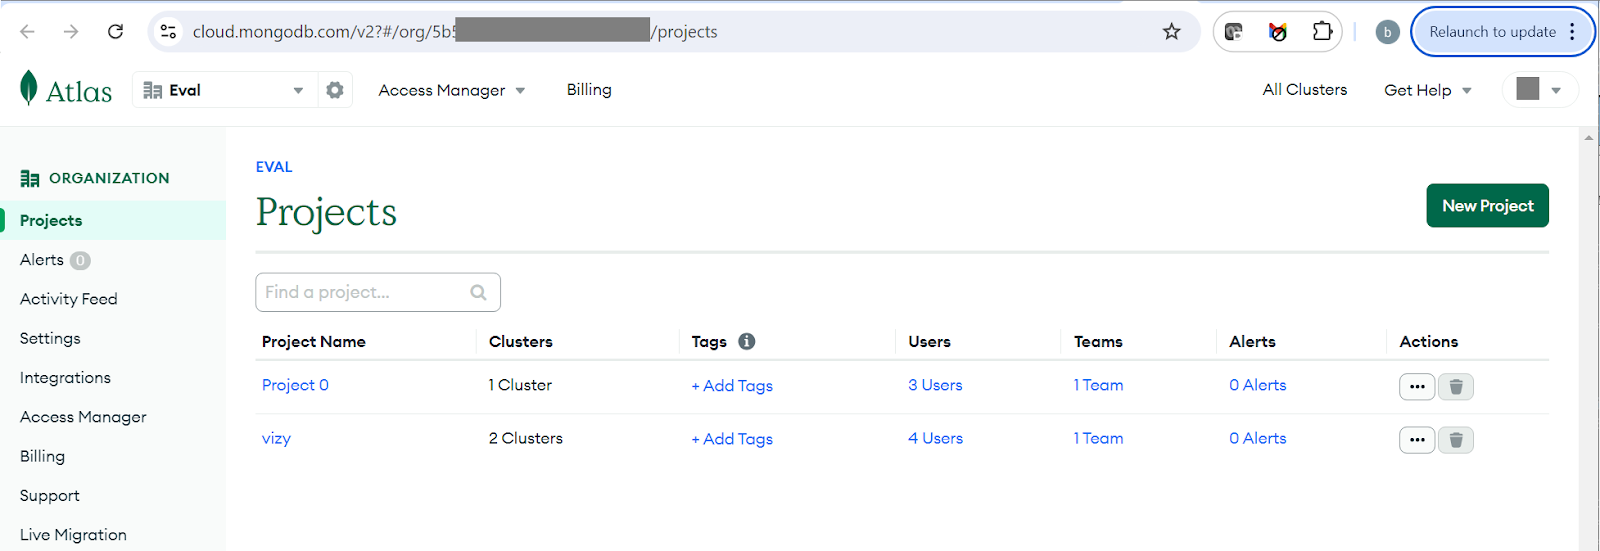
opens the standard MongoDB Atlas organization page (if necessary you will be asked to log in!)
Clicking the left side icon here

opens the standard MongoDB Atlas project page (if necessary you will be asked to log in!)
These are just a few examples of how Qarbine can provide detailed MongoDB Atlas operational information from which you can easily open specific MongoDB Atlas web console pages.